Categories
Are you ready to up your game in market trends analysis?
We’re about to dive headfirst into the world of market trends analysis.
Market trends analysis isn’t just some fancy jargon. It’s the secret sauce that can take your business to the next level.


Yep, you read that right.
In the present quick-moving business world, remaining ahead is essential. Whether a seasoned business owner or a data-savvy professional, understanding market trends analysis is your ticket to success.
Market trends analysis isn’t about complex algorithms or mind-boggling equations. It’s about making sense of data, spotting patterns, and turning numbers into actionable insights. Guess what?
We will show you how to do it – not once.
So, if you’re the type who loves gathering data and presenting your findings with captivating charts and graphs, you’re in the right place.
In this blog, you’ll learn the following:
Definition: Market trends analysis is about studying the past and present data to predict the future.
Picture this: you’ve got a small business and want to know which products or services will be a hit in the upcoming months.
That’s where market trends analysis comes in.
You can spot patterns and better decision-making process by examining historical data and current market conditions.
It’s not rocket science. It’s tied in with transforming numbers into significant bits of knowledge.
Why should you bother with market trends analysis?
Well, this is your secret weapon if you’re a business owner or someone who deals with data regularly.
It can help you stay ahead of the competition, make smart investments, and seize opportunities before they slip.
Imagine transforming your data into compelling charts and graphs that tell a story. That’s what market trends analysis is all about – empowering you to make data-driven decisions.
Let’s dive into why market trends analysis is crucial.
Imagine you’re the captain of a ship sailing through the unpredictable waters of the business world.
You want to steer your vessel in the right direction by avoiding treacherous reefs and turbulent waves.
That’s where market trends analysis comes in.
It’s your compass, guiding you with insights into consumer behavior, industry shifts, and economic indicators. With this knowledge, you can make decisions about product development, marketing strategies, etc.
Market trends analysis ensures you don’t sail blindly; you navigate purposefully.
Picture this scenario.
You’re running a race against competitors in your industry. The finish line represents success and profitability.
To get there first, you need to run faster, smarter, and with better strategies. Market trends analysis gives you that edge. It keeps you updated on what’s happening in your market.
This can help you to adapt and innovate swiftly.
While your competitors might be trudging along, unaware of changing market conditions, you’ll sprint ahead. That’s the competitive advantage that market trends analysis offers.
It’s not just about keeping up. It’s about taking the lead.
In business, storms can brew suddenly, threatening to capsize your ship.
What if you could spot those storms on the horizon and navigate away?
That’s precisely what market trends analysis does for you. It helps identify potential risks and challenges early, enabling you to take proactive measures. Doing so reduces the negative impact of unforeseen events on your business.
It’s like having a radar that scans for danger and alerts you.
While sailing through uncharted waters, you might encounter hidden islands of opportunity.
Market trends analysis is your map to help you discover emerging opportunities, niches, and untapped markets.
It’s not just about avoiding obstacles but finding the hidden treasures within them.
Market trends analysis can help you optimize resource allocation in your business.
It can help direct your investments toward the most potential return on investment (ROI) areas—no more shooting in the dark.
In a nutshell, market trends analysis is your compass, your competitive edge, your radar, and your treasure map all rolled into one.
This is where the magic happens.
It’s where you uncover insights that can transform your business. We’ll walk you through the process step by step.
Think of this as setting your destination on a GPS.
What aspects of the market do you want to explore?
Is it consumer behavior, industry developments, competitor actions, or emerging opportunities?
Be clear about your objectives, and you’re on the right track.
You need data.
Look everywhere – market research reports, industry publications, government statistics, customer surveys, social media trends, etc.
But here’s the catch.
Ensure it’s accurate, up-to-date, and covers all the bases.
Have you ever heard the phrase, “Don’t put all your eggs in one basket”?
This is what segmentation is all about. Divide the market into demographics, geography, psychographics, or behavior segments.
This helps you focus your analysis on specific customer groups or market niches. It resembles having an amplifying glass for your information.
Fire up your analytical tools and analyze your data.
Look for patterns, trends, outliers, and correlations. That is where outlines and diagrams come in.
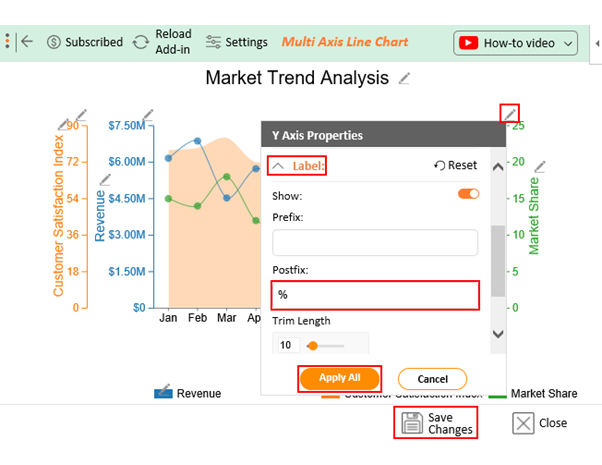
Visualize your data using business graphs like the Multi-Axis line Chart. This isn’t just about numbers; it’s about looking for stories that make sense to your audience.
Congratulations on successfully learning market trends analysis in-depth.
Now, it’s time to unlock the true potential of your data by analyzing it for valuable insights through Business Analytics.
While tools like Excel help organize data, they lack the powerful charts that can effectively display market trends.
Don’t worry.
There’s an intriguing solution called ChartExpo that can elevate your data analysis to an unprecedented level.
ChartExpo is a powerful tool that will revolutionize how you explore your data. With its user-friendly interface and a wide range of charts, ChartExpo effortlessly transforms your data into meaningful insights.
You don’t need to be an expert in programming or business research methods to utilize ChartExpo’s features effectively.
One of ChartExpo’s standout features is the Multi-Axis Line Chart, which enables you to dive deeply into your financial data and uncover hidden insights.
Try ChartExpo’s free 7-day trial and experience its full potential.
In this segment, we’ll utilize ChartExpo, and test information to show the way that you can utilize Multi Pivot Line Graph to picture your information for patterns and different experiences.
Before we plunge into this, we’ll tell you the best way to introduce ChartExpo in Succeed.
| Months | Revenue | Market Share | Customer Satisfaction Index |
| Jan | 6160000 | 15 | 78 |
| Feb | 6870000 | 14 | 79 |
| Mar | 4530000 | 18 | 84 |
| Apr | 5730000 | 12 | 72 |
| May | 5170000 | 11 | 71 |
| Jun | 5810000 | 18 | 81 |
| Jul | 5210000 | 11 | 82 |
| Aug | 5740000 | 12 | 71 |
| Sep | 4090000 | 18 | 83 |
| Oct | 6170000 | 14 | 77 |
| Nov | 5860000 | 16 | 81 |
| Dec | 6900000 | 16 | 74 |
To get started with ChartExpo in Excel, follow the steps below:


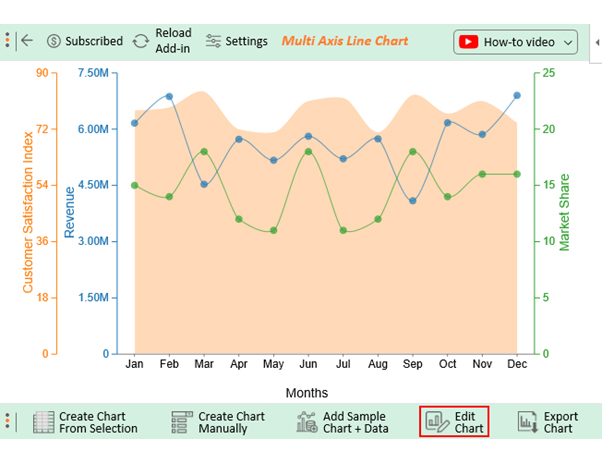


There’s a noticeable revenue fluctuation across the year, with the peak earnings occurring in February and December.
These patterns hint at a seasonal trend, potentially influenced by factors such as holidays or weather conditions.
The market share exhibits steady trends, hovering from 11% to 18%. This stability may indicate a well-balanced competitive landscape or a consistent market positioning strategy.
Customer satisfaction scored an impressive 84, and again in September, registered a noteworthy 83.
These periods stand out as moments of exceptional customer contentment.
The three types of trend analysis are:
Market trend analysis techniques involve methods to identify patterns and predict future market behaviors. Key techniques include:
In conclusion, market trends analysis isn’t just a buzzword.
It’s the compass that guides your business through the unpredictable waters of the market. With the right tools and techniques, like ChartExpo, you can uncover valuable insights and stay ahead of the game.
ChartExpo, an Excel add-in, is your secret weapon.
It offers over 50 visually compelling charts, including specialized ones like the Likert Scale Chart and CSAT Score Survey Chart.
The best part?
You can try it out for free with a 7-day trial. After that, it’s just $10 – a small investment for a significant return.
So, whether you’re a business owner or data enthusiast looking to make data-driven decisions, market trends analysis is your ticket to success.
It’s about informed choices, competitive advantage, risk mitigation, opportunity identification, and optimized resource allocation.
Don’t wait any longer.
Dive into the world of market trends analysis and unlock the benefits it holds for your business.
Try ChartExpo, explore the trends, and chart your path to success today.
How much did you enjoy this article?


We will help your ad reach the right person, at the right time

Actionable insights discovered for you. Now you can do more in less time.

PPCexpo Keyword Planner will help you align your keywords with the customers’ intent.

Frequent audits will help you optimize your PPC campaign for success.

Visualizations give you the ability to instantly grasp the insights hidden in your numbers.

Experience the new revolution in reporting … click your way to insights, don’t scroll.

Calculate the number of combinations in your PPC campaign. It may surprise you.
Related articles


Data reporting is key to making informed decisions. Learn how to streamline your reports, avoid common pitfalls, and enhance your decision-making process.

Predictive Analytics turns data into action when pressure is high and budgets are tight. See how it drives results where it matters most. Learn more!

Is your sales funnel hiding stalled deals or false forecasts? Learn how to fix mid-funnel decay and align teams for real revenue. Get started now!